PropertyARC: The Best Real Estate Dashboards, Stacking Plans, And REIT Solution

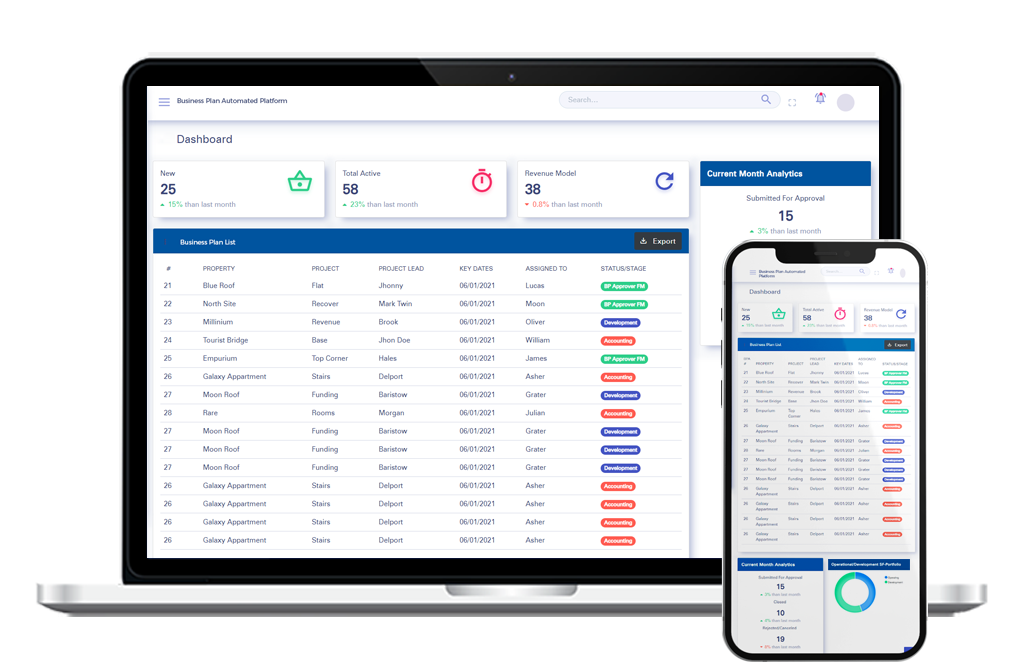
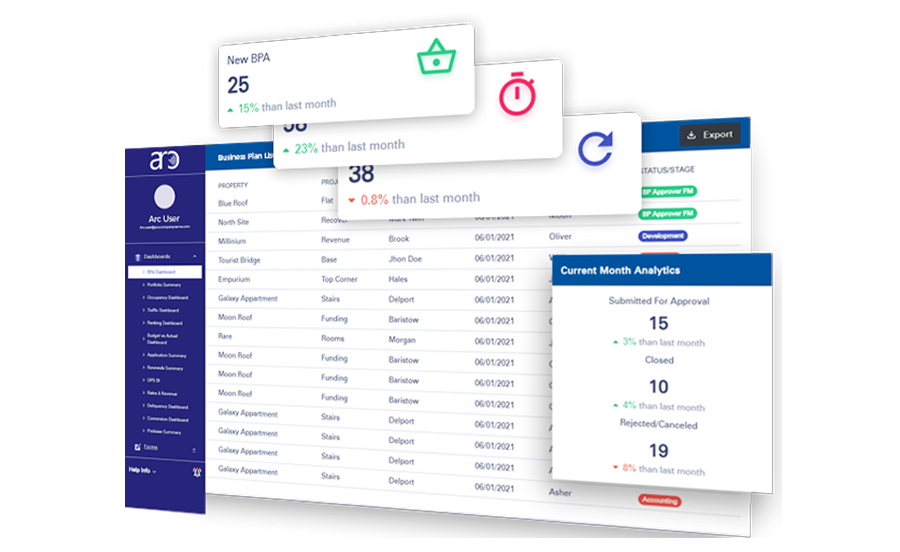
Revamp your real-estate operations with Al Rafay Consulting’s best real estate dashboards, stacking plans, and REIT solutions. Boost your business operations through advanced analytics and data visualizations. Our cloud-based, data-driven, and cost-effective top REIT solution is revolutionizing the real estate and commercial property management industries. Partner with Al Rafay Consulting to get the best real estate analytics software solutions.
BPAP Main banner

Transforming Industry Operations - ARCs Best Real Estate Dashboards And Stacking Plans Solution

It is more important than ever to find ways to streamline operations and improve efficiency. ARCs Best real estate dashboards and stacking plans solution can help you do just that. Our innovative software is designed to help you manage your properties more effectively, from tenant screening to onboarding and maintenance requests. Whether you are a property owner, manager, investor, or developer, ARCs real estate solutions can help you achieve your goals and grow your business. With our top REIT solution, you can access advanced analytics portals that provide you with valuable insights and dashboards on various aspects of your real estate portfolio. The key features of PropertyARC are the following:

  • REIT dashboards
  • Advanced and intuitive stacking plans
  • C-level dashboards


BPA Solution

Advanced Analytics Portals

Our real estate analytics solution provides you with advanced analytics portals that allow you to access and use various features and functions such as REIT dashboards, stacking plans, and C-Level dashboards. These portals are designed to help you visualize and optimize your real estate portfolio, manage your properties efficiently, and generate maximum returns on your investments.

Features of Our Real Estate Analytics Solution

REIT

Managing a REIT portfolio can be challenging and complex, especially in a dynamic and competitive market. That’s why you need our top REIT solution that offers you the following dashboard features:
Expiring Leases
This is one of the most important dashboards in our REIT solutions portal. The dashboard provides a very detailed overview and insights into upcoming lease expirations. It highlights key metrics such as lease end dates, rental income, and square footage for expiring leases. The interactive visualizations allow users to filter and segment the data based on different criteria like property type, market, or lease duration.
Capex (Capital)
The Capital Expenditure Dashboard provides landlords and property managers with an overview of capital expenditure (CapEx) budgets versus actual expenses. It allows users to track and compare planned budgets with actual spending, providing insights into project performance and cost management. Visualizations and metrics help identify variances, monitor CapEx utilization, and assess the financial impact on the portfolio.
Finance (EBITDA)
The finance or EBITDA dashboard in our REIT management tools provides a simplified yet comprehensive analysis of the net operating income of a company. It provides interactive visualizations that allow users to track financial performance, analyze revenue and expense trends, and assess profitability across properties, regions, or other dimensions. With the help of this dashboard, users can compare performance over time, identify cost-saving opportunities, and make informed financial decisions.
Delinquency
Rental property owners can view and manage your delinquency, which shows the amount of money that you are owed by your tenants who have not paid their rent on time. It visualizes delinquent payments across properties, tenants, and time periods, providing an overview of outstanding balances, aging categories, and delinquency ratios.
Building Lists
With this dashboard, you can view and manage your list of buildings that are owned, operated, or financed by your company. This dashboard allows users to monitor their real estate portfolio, analyze regional variations, and make informed decisions on rental rates and property development. With features like hover functionality, period filters, and building details, the dashboard offers a user-friendly experience for accessing key information.
Tenants Listing
This dashboard helps you view and manage your list of tenants that occupy your buildings. Through interactive visualizations, it provides insights into tenant information, such as square footage occupied, and rental income. This in turn helps property managers identify high-value tenants, track occupancy rates, and analyze tenant-related financial metrics. Users can filter and segment the data based on various dimensions like market, region, or industry.
Executive OPS BI
This provides a comprehensive overview of the rent roll information. It provides interactive visualizations that allow users to analyze and track rental income, occupancy rates, leased square footage, and other critical rent roll metrics. Users can view data at a portfolio level or drill down to individual properties or tenant details. The dashboard provides insights into rent roll performance trends, identifies high-value tenants, and enables effective revenue management and forecasting.
Tenant Portfolio
You can view and analyze your tenant portfolio, which shows the distribution and composition of your tenants across your buildings. The Tenant Portfolio Dashboard presents a simple yet effective table displaying the Leased Square Footage (LSF) and Rent payments for each parent tenant. This helps property managers easily compare the leasing and rental performance of their tenant portfolios.

Stacking Plans

Stacking plans are one of the most useful and effective tools to visualize and optimize your real estate portfolio. However, creating and updating stacking plans can be time-consuming and tedious, especially for large and complex portfolios. Our stacking plans software makes these property analytics tasks easier with the help of the following feature overviews:
Tenant Overview
One of the features of the stacking plans portal is tenant overview. You can view and manage your tenant overview, which shows the basic information and status of your tenants. You can see the tenant name, lease start and end date, rent amount, square footage, etc.
Occupancy Analytics
You can view and analyze your occupancy analytics, which shows the distribution and composition of your tenants across your buildings. You can get rapid analysis of occupancy and vacancy rates, contributing to effective space management.
Company Profiles
The solution can enumerate all companies housed within the property, fostering familiarity with the tenant ecosystem.
Lease Term Tracking
You can view and manage your lease term tracking, which shows the duration and expiration of your leases. You can see the lease start and end date, lease term, remaining term, etc. You can also see the lease status, such as active, expiring, or expired. You can also plan and execute your lease renewal or termination strategies, and optimize your lease terms and conditions.
Space Availability
With the help of powerful visualizations, you can view and manage your space availability, which shows the amount and location of the available space in your buildings. You can see the floor number, unit number, square footage, rent per square foot, etc

C-Level Dashboards

C-level dashboards are one of the most important and powerful tools to monitor and improve your real estate performance. Our C-Level Reporting Tool is a dynamic web-based application designed to empower top executives with crucial insights into their real estate portfolios. With a keen focus on high-level metrics, this tool provides a panoramic view of key financial indicators and tenancy details. This allows for quick yet informed decision-making.
Rent Roll Overview
Residential and commercial rental management becomes very easy for property managers with the C-level portal. It helps you manage your rent roll overview, which shows the summary and details of your rent collection and income.
Customizable Charts
The portal allows you to view and customize your charts, which show the graphical representation of your real estate data and metrics. You can choose from various types of charts, such as bar, line, pie, etc.
Asset Valuation
You can view and analyze your asset valuation, which shows the estimate and appraisal of your property value and equity. It basically summarizes gross asset value and potential loan information, which is critical for investment and divestment strategies.
Tenancy Information
You can view and manage your tenancy information, which shows the summary and details of your tenant occupancy and utilization. You can see the total tenants, active tenants, expiring tenants, vacant tenants, etc.
Future Rent Projections
The portal not only provides the rent roll information but it takes income management to the next level by forecasting expected changes in rent rolls, aiding in long-term financial planning.

Benefits of Our Top REIT Solution

There are numerous benefits of implementing our top REIT and stacking plans solution. Some of the most highlighted advantages are the following:
sharepoint Dynamic Cross functional Team Proficient In Current Technologies And Tools
Real-time Insights
By using our real estate dashboards and analytics platform users can get a look at real-time data and insights to make effective and data-driven decisions.
Enhanced Portfolio Management
The platform allows for the management of not only 1 or 2 properties, but rather you can manage entire portfolios with ease and on a single platform.
Strategic Financial Planning
It is a perfect platform for C-level executives and supports C-level strategy with projections of future rent rolls and asset valuation.
Simplified Stakeholder Reporting
Our top REIT solution transforms complex data into a clear visual format, streamlining stakeholder communication and enhancing decision-making.

Benefits

Technology

Lorem ipsum dolor sit amet, consectetur adipiscing elit. Ut elit tellus, luctus nec ullamcorper mattis, pulvinar dapibus leo.

Frequently Asked Questions

Can you provide some examples of real estate dashboards?
Absolutely! There are numerious types of dashboards available in the PropertyARC analytics solutions, including building lists, expiring leases, delinquency etc.
Can Al Rafay Consulting customize the software based on specific needs?
Yes. Our team of expert developers can make customized features and real estate dashboards for any needs. We can also integrate data from multiple sources and data warehouses to cater to the needs of every customer.
How can I embed the real estate dashboard into my existing tools and platforms?
Our real estate dashboard solutions offer tools for easy embedding into various platforms, making it convenient for real estate professionals to integrate them into their workflow.
What kind of results can be achieved using ARC's real estate analytics?
With ARC's real estate analytics, professionals can gain insights into sales performance, team productivity, and overall ROI, among other crucial metrics.